 |
bookmark this page - make qweas your homepage | |
| Help Center - What's New - Newsletter - Press | ||
| Get Buttons - Link to Us - Feedback - Contact Us |
| Home | Download | Store | New Releases | Most Popular | Software Guides | Special Prices | Rate | Updated | FAQ |
|
|
Fx Audio Editor 4.7.3 - User Guide and FAQScreenshots - More Details
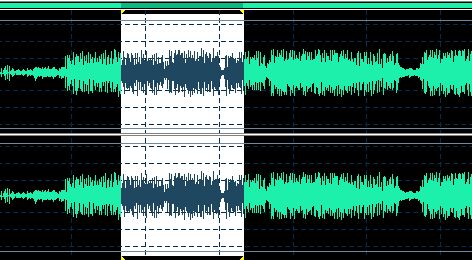
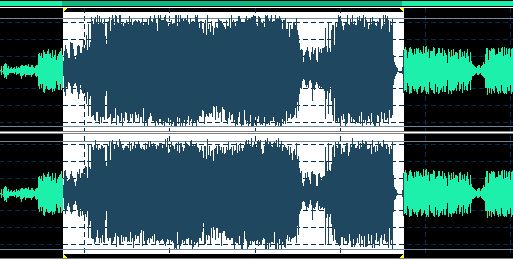
Editing SoundSound is created by the physical vibration of an object, transmitted through the air as tiny and very fast changes in air pressure. Such transmissions are called longitudinal waves.To illustrate, the picture below represents hard rubber balls strung on a tight wire, separated by springs. Movement of the leftmost ball compresses the spring to it's right, then when that spring decompresses it transfers the energy to the next ball and so forth until the energy has been transmitted the entire length. The eardrums receive air pressure changes by matching the vibration much as an inert tuning fork will match the vibration of an active tuning fork when they are brought together, then our brains interpret the vibrations as sound. If we were to bang the left ball against the springs twice in the period of one minute the frequency of our banging would be 2 cycles per minute. If we did it twice every second the frequency would be 2 cycles per second or 2 Hz. In sound terms, each event from the first movement of the left ball to the last movement of the right ball is called a sample. In the below illustration, time is represented by the horizontal axis and the frequency (or pitch) is represented by the samples. To properly chart the action of sound we also need to add a scale for the vertical axis to represent the amplitude or volume of the wave. This scale will represent decibels abbreviated db. Unfortunately, sound is not quite as simple as our graph because sound doesn't have a regular amplitude, frequency or time and it comes at us with both high and low amplitudes mixed together. This combination of frequencies is called timbre or tone color. Timbre is described as rich or full when there are many different frequencies contained in the sound and described as dull when it has few. Altogether, the different frequencies at varied amplitudes of a sound are known as the spectral content of the waveform. Below is a picture of a digital sound file that's a bit over 6,000,000 samples long. The actual length of the sound is determined by the sample rate which is a count of the number of samples in a second. The higher the sample rate, the more accurate the sound. This particular sound file was sampled at a frequency of 22 kHz per second. We'll explore that further in a minute. At this point it might be worth noting that most digital audio software confuses quality with accuracy assuming that more samples per second means higher quality. In actual fact the opposite might well be true. If your source is very bad, leaving out some data might well make it sound better. In our audio editor we can select any section of the file and zoom in to obtain a closer look. The below illustration represents the selected samples of a the above sound file beginning with sample number 878,750 and ending with sample 887,500. We know that this sound file was sampled at a frequency of 22 kHz per second so it follows that the 8750 samples will take .39 seconds to play. To be a cool DJ: This is the status when one portion of your favorite file has been selected.  Use the paste from file button  to open an audio file, then paste to the seledcted portion. You will get this graph. to open an audio file, then paste to the seledcted portion. You will get this graph.Now, play your work done by yourself and experience the cool feeling this tool brings you. Similar operations can also be repeated to get more fantastic audio files. Screenshots - More Details |
|
Search -
News -
Discount -
Top100 -
Featured -
Picks -
Hot -
Directory -
Service -
Developer -
Partner -
Resource
© 2006 Qweas Home - Privacy Policy - Terms of Use - Site Map - About Qweas |


 Download Site 1
 Buy Now $39.95