 |
bookmark this page - make qweas your homepage | |
| Help Center - What's New - Newsletter - Press | ||
| Get Buttons - Link to Us - Feedback - Contact Us |
| Home | Download | Top100 | Store | New Releases | Popular | Software Guides | Special Prices | Rate | Updated | FAQ |
|
|
DreamCalc Graphing Calculator 4.1 - User Guide and FAQScreenshots - More Details
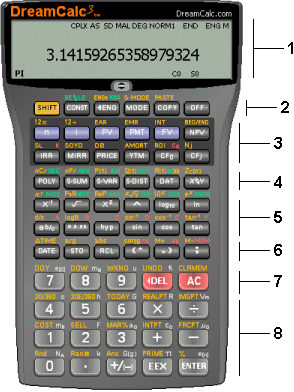
Interface Layout  The user interface looks and feels like a real hand-held calculator and operates in a similar way. You can click the keys with the mouse or use your keyboard. It is specifically designed to provide a near tactile experience. The DreamCalc interface emulates a hand-held calculator as far as it makes sense to do so. The [SHIFT] key grants you access to the functions printed above the keys, just as you would naturally expect. You can even control most mode settings using the [MODE] key and on-screen menus. There are some tasks, however, which are best done with a software style interface using standard window controls. This is where DreamCalc is a real advantage over a separate hand-held. The entry of list data and graphing are done in a separate floating tool window. If you were wondering why the numeric screen area is small compared to some calculators--it isn't used for list data or graphing, so doesn't need to be any larger. Keypad Sections The keypad can roughly be categorized into sections, as follows:
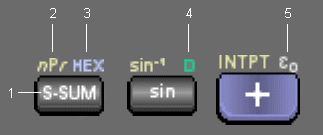
 Each key typically supports several functions or input mnemonics. See right. The colors vary depending upon the chosen skin, however, the color scheme remains consistent. Each is colored uniquely.
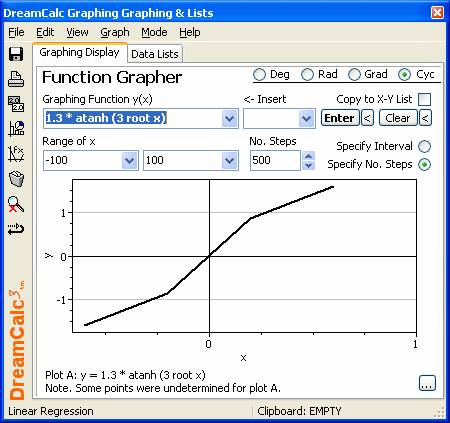
 Graph Menu. This is used to select a required plot from the list of those currently available. For example, you may select Graph->Function Grapher to plot a mathematical function over a prescribed range, as shown above. Alternatively, you may choose to plot list data using a charting option applicable to the current statistical mode. When in Standard Data (SD) mode, the SD list will be active and you may select from histograms, pie charts, bar charts and frequency polygons. In X-Y regression modes, you may plot X-Y data and show an optional line of regression fit. Statistical Mode Menu. Used to change the calculator's statistical mode. You may switch from the Standard Data (SD) mode, which provides for weighted values, to one of a range of X-Y regression modes. Changing the mode will also change the calculator's main statistical mode, and will determine which data list is active and which charts are available from the Graph menu. For more information on statistical modes, see Statistical Modes & Calculations. Graphing Display Page Tab. Renders the desired data or function plot. For X-Y style charts, you are able to zoom by dragging a rectangle over the graphing area. Unzoom is available using the tool button on the left side bar or by selecting the View->Unzoom menu option. Data List Tab. This page allows for the input and manipulation of list data using a spreadsheet style interface. DreamCalc has two independent lists--Standard Data (SD) and an X-Y list used for regression modes. The current statistical mode determines which list is active. The data entered here is used when performing statistical calculations from the calculator main interface, as well as in plotting the graphing display. Graph Variants Button. This button provides quick access to display options known as variants. For example, if an X-Y style graph is selected, this will allow you to set logarithmic axis variants, and with the Professional Edition of DreamCalc, select polar plots. For SD frequency charts, graph variant options include cumulative and relative displays. For more information, see the Graph Variants section. Screenshots - More Details |
|
Search -
News -
Discount -
Featured -
Picks -
Hot -
Directory -
Service -
Developer -
Top Download -
Resource
© 2006 Qweas Home - Privacy Policy - Terms of Use - Site Map - About Qweas |


 Download Site 1
 Buy Now $25.99